Klaus Eckelt

Hi! I am Klaus. I'm a doctoral researcher, instructor, and PhD student in the Visual Data Science Lab at Johannes Kepler University Linz, Austria.

My research focuses on interactive visualizations in the biomedical field. Together with my colleagues, I design and build data analysis tools to support domain experts. I received my master's and bachelor's degrees at TU Wien, Austria, where I became interested in life sciences and the analysis of biomedical data.

Publications

Papers

Teaser image of the paper showing a scatterplot with chess game states as points. States of the same game are connected with lines. The lines are in three different colors, showing which type of opening was chosen by the first player. Inside the scatterplot, five clusters are game state clusters are selected. A sidebar on the right summarizes each cluster and shows their differences.

Kokiri: Random-Forest-Based Comparison and Characterization of Cohorts, Klaus Eckelt, Patrick Adelberger, Markus J. Bauer, Thomas Zichner, Marc Streit, IEEE VIS Workshop on Visualization in Biomedical AI, doi:10.1101/2022.08.16.503622, 2022.

Paper: PDF | Software | Video | BibTeX
Talk @ IEEE VIS 2022: Video | Slides
Teaser image of the paper showing a scatterplot with chess game states as points. States of the same game are connected with lines. The lines are in three different colors, showing which type of opening was chosen by the first player. Inside the scatterplot, five clusters are game state clusters are selected. A sidebar on the right summarizes each cluster and shows their differences.

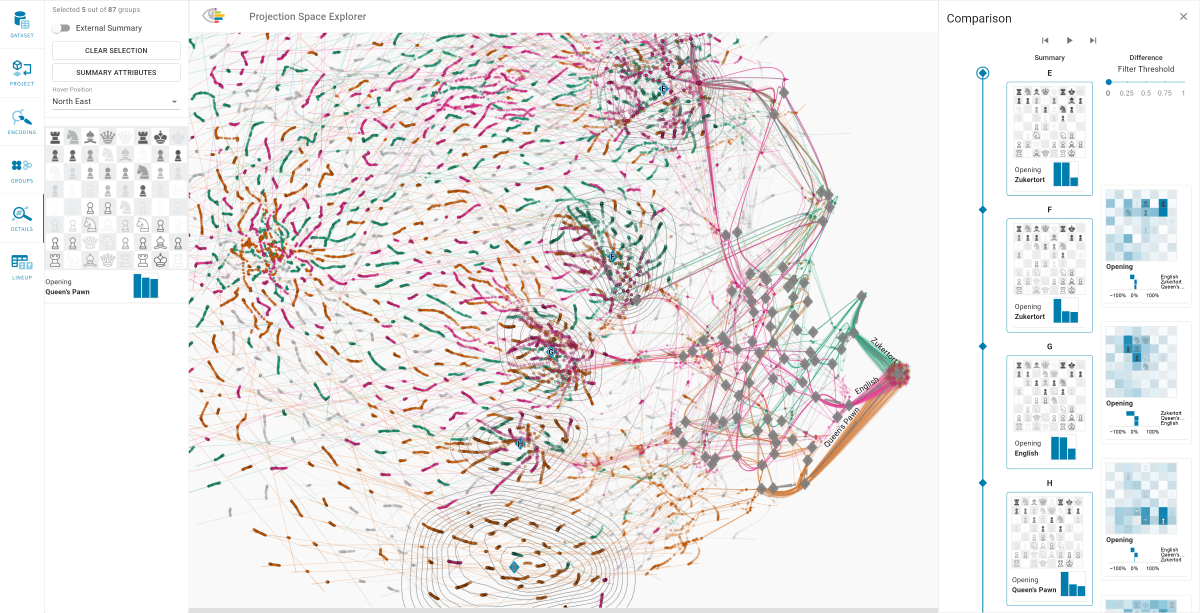
Visual Exploration of Relationships and Structure in Low-Dimensional Embeddings, Klaus Eckelt, Andreas Hinterreiter, Patrick Adelberger, Conny Walchshofer, Vaishali Dhanoa, Christina Humer, Moritz Heckmann, Christian A. Steinparz, Marc Streit, IEEE Transactions on Visualization and Computer Graphics, vol. 29, no. 7, pp. 3312-3326, doi:10.1109/TVCG.2022.3156760, 2023.

Paper: PDF | Software | Video | BibTeX
Talk @ BioVis 2022: Video | Slides
Talk @ IEEE VIS 2022: Video | Slides
Teaser image of the paper showing an analysis in the Coral application. The graph in the upper half of the application shows all cohorts created in the analysis session and how they were created. In the lower half, the user is filtering six cohorts by the KRAS gene mutation G12C. A bar chart shows that this mutation is distributed differently depending on the 'patients' gender and race.

Coral: a web-based visual analysis tool for creating and characterizing cohorts, Patrick Adelberger, Klaus Eckelt, Markus J. Bauer, Marc Streit, Christian Haslinger, Thomas Zichner, Bioinformatics, 37(23): 4559-4561, doi:10.1093/bioinformatics/btab695, 2021.

Teaser image of the paper showing TourDino's integration in Ordino. There are three columns: the first column shows a table in Ordino; the second column shows a correlation analysis of that table in TourDino; the third column compares different data sets from the table with each other using TourDino.

TourDino: A Support View for Confirming Patterns in Tabular Data, Klaus Eckelt, Patrick Adelberger, Thomas Zichner, Andreas Wernitznig, Marc Streit, EuroVis Workshop on Visual Analytics (EuroVA '19), doi:10.2312/eurova.20191117, 2019.

PDF | Software (integrated in Ordino) | Video | BibTeX
Talk @ EuroVIS 2019: Slides

Posters

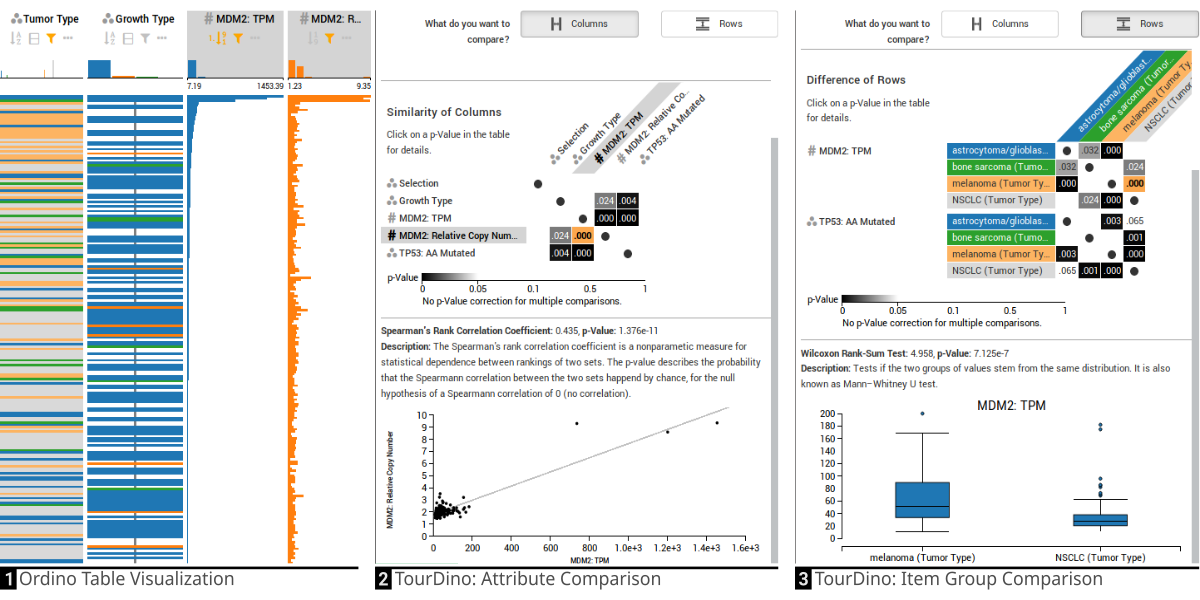
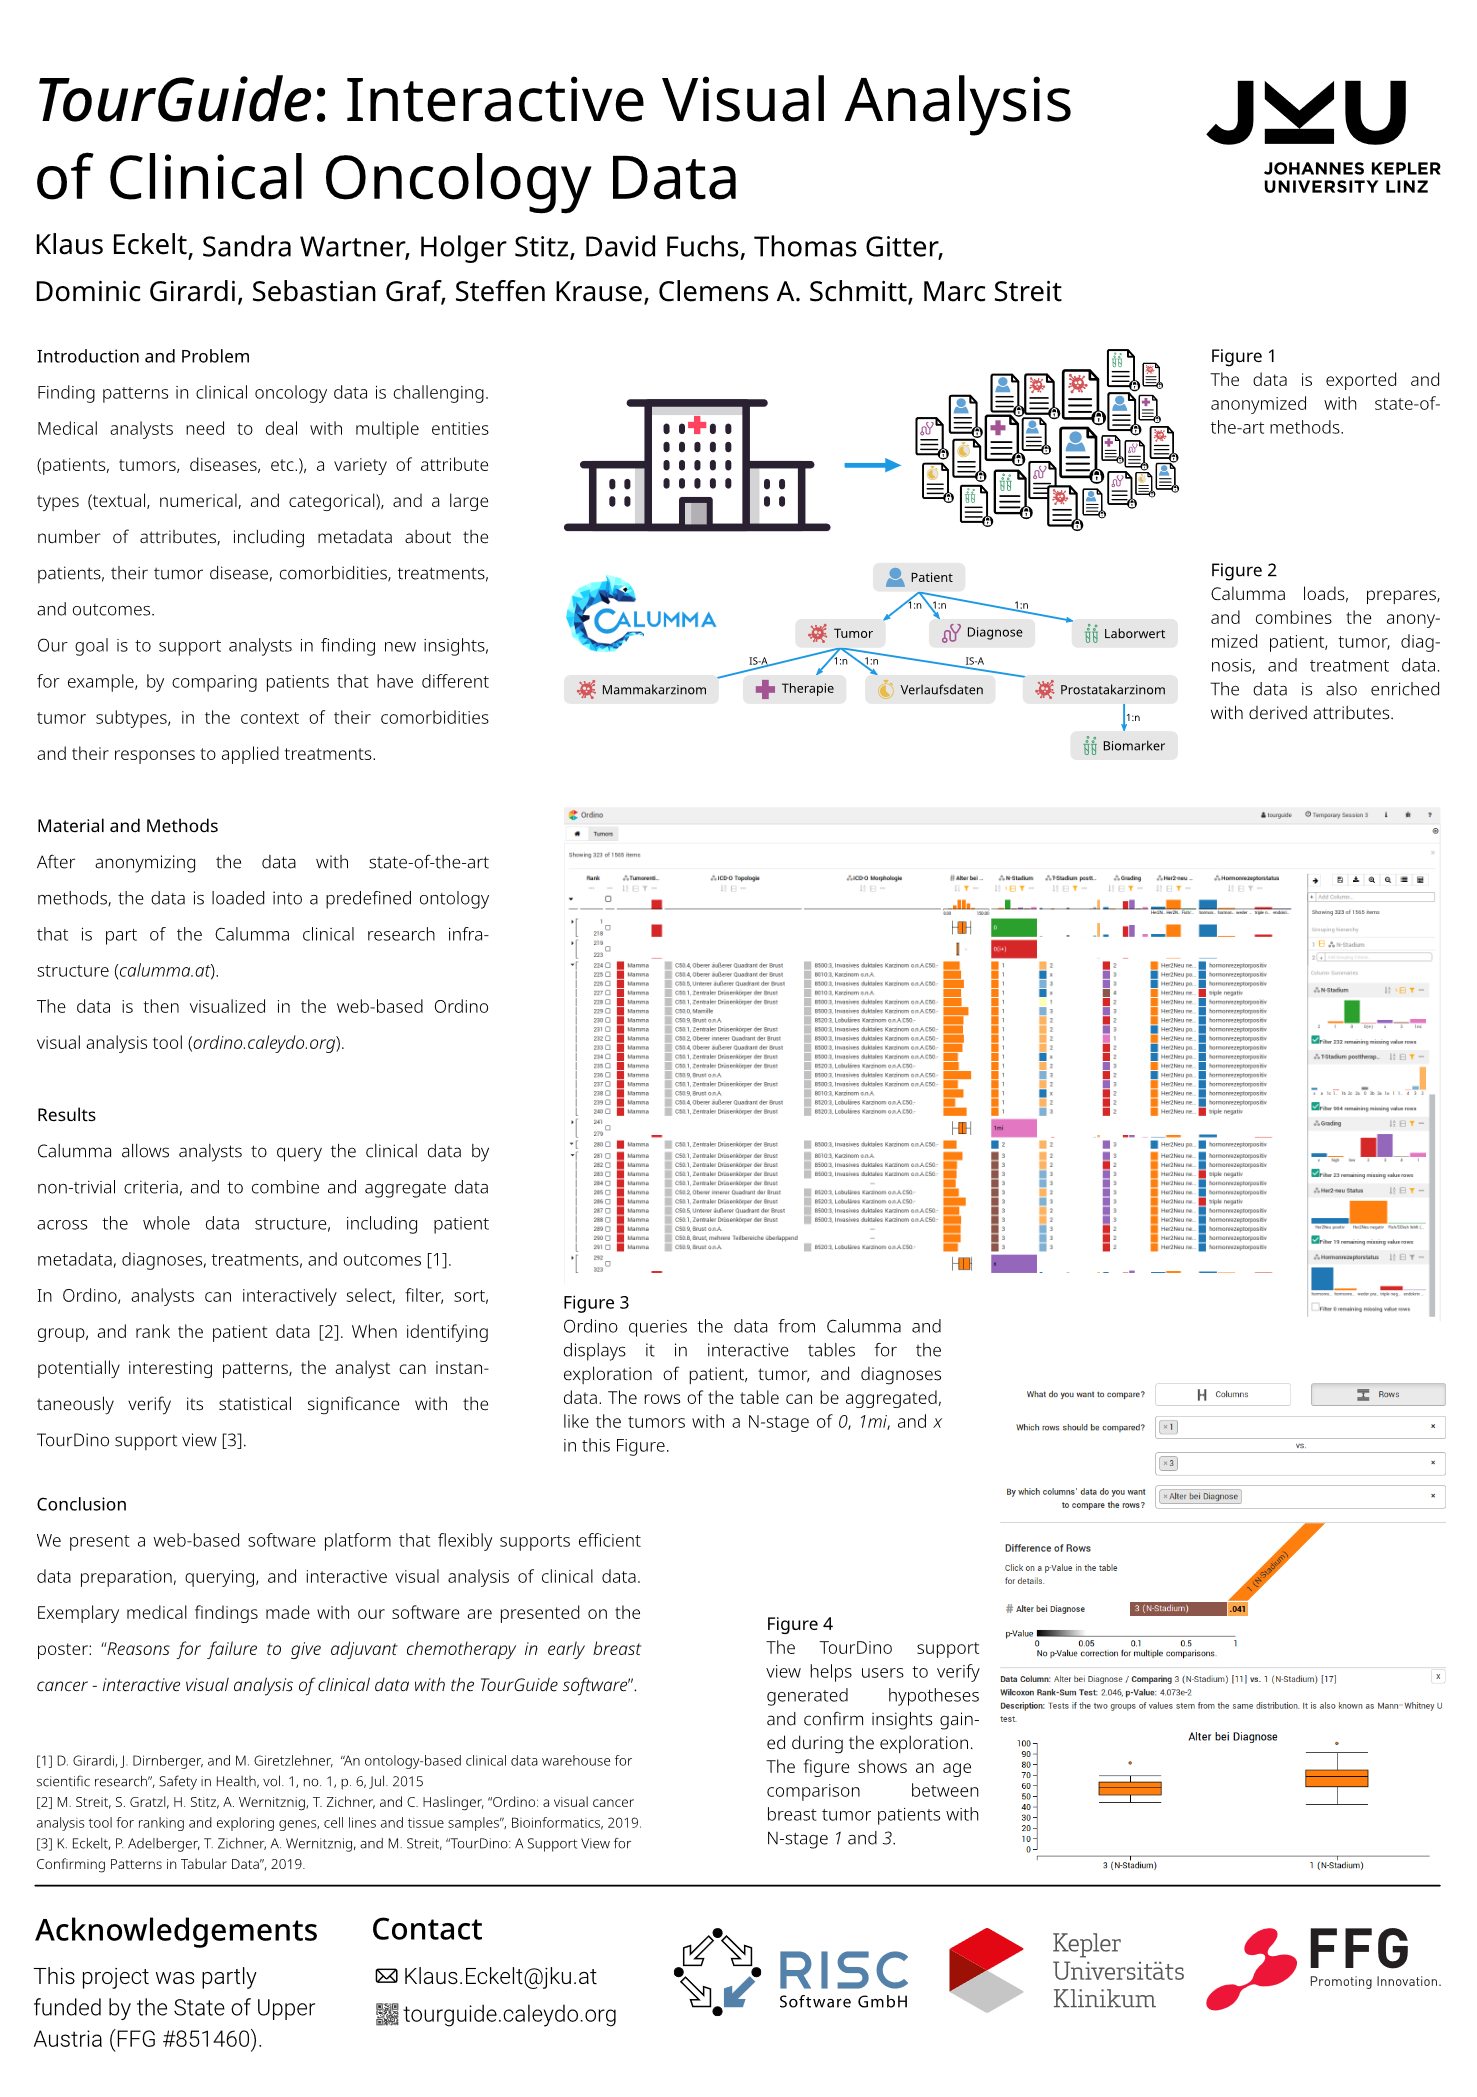
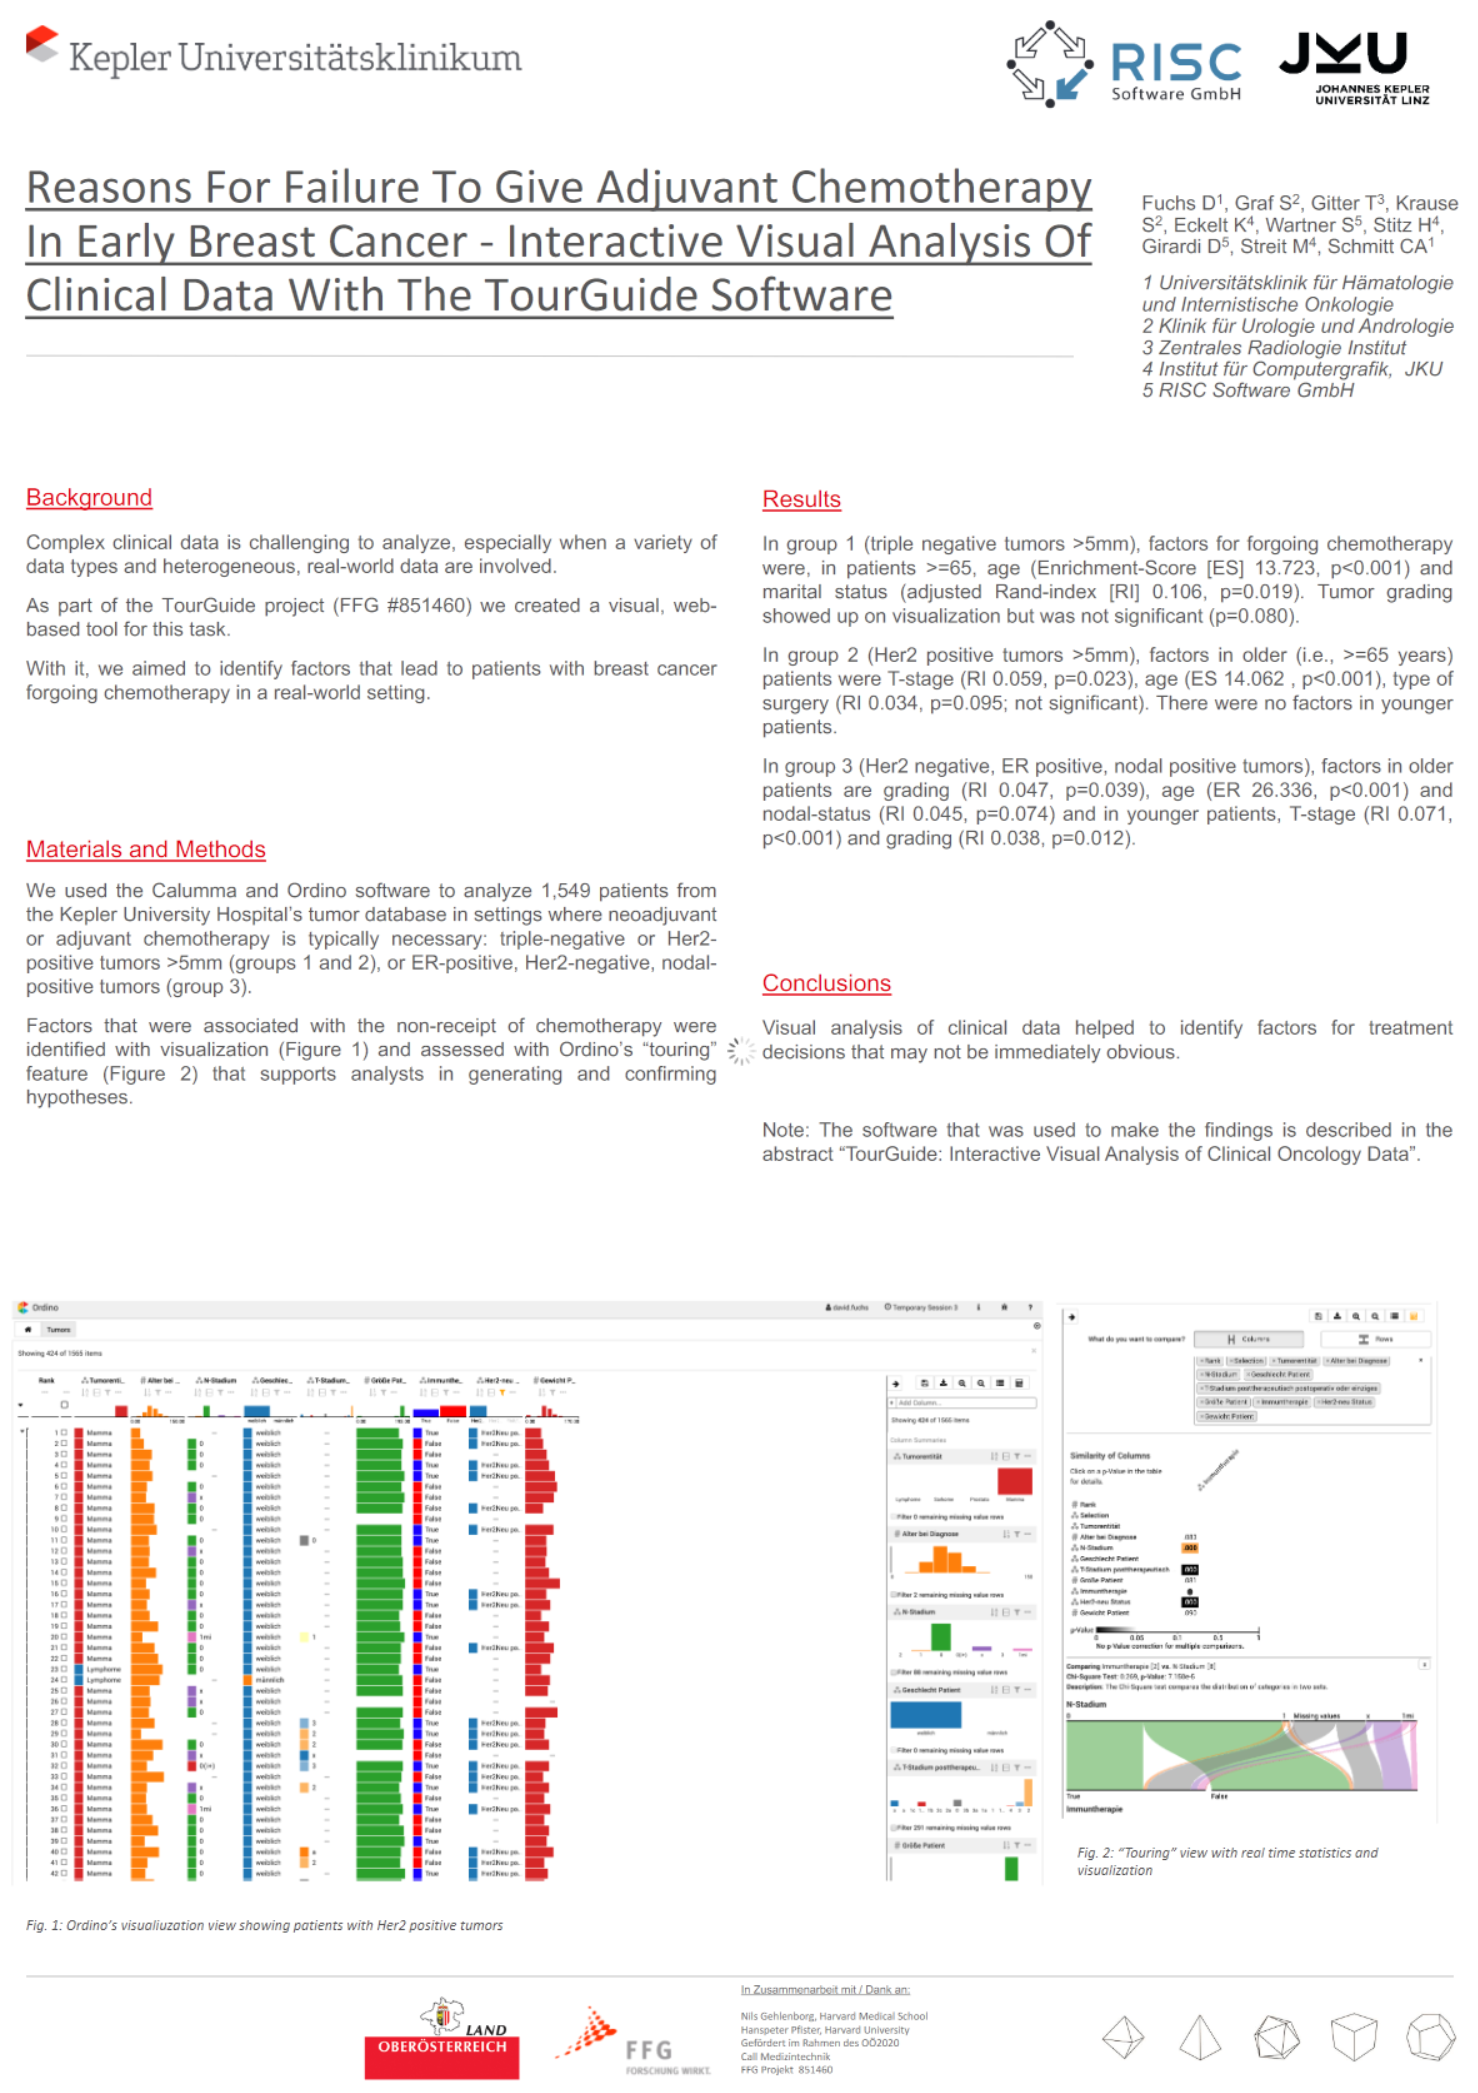
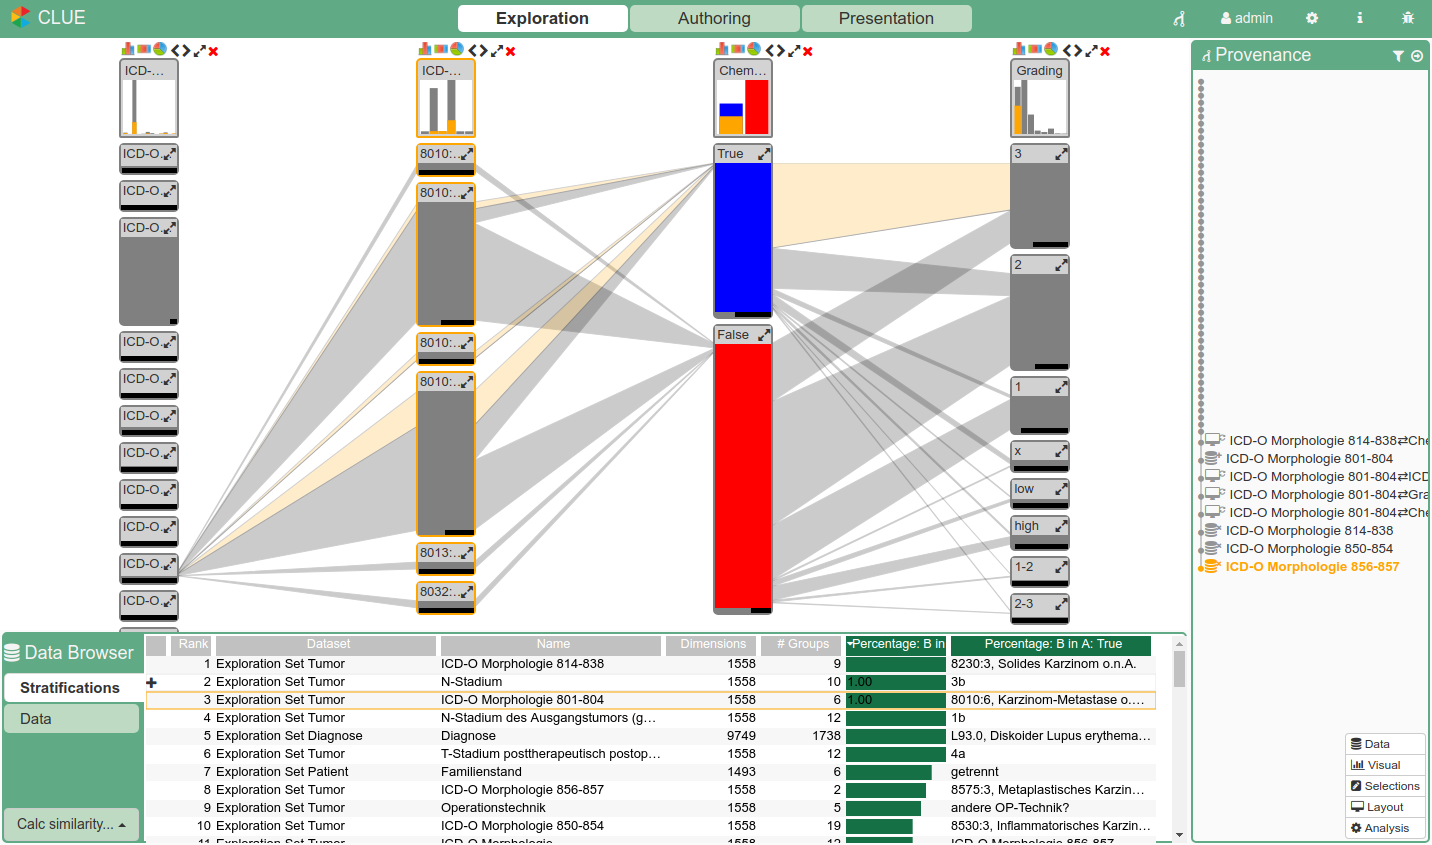
TourGuide: Interactive Visual Analysis of Clinical Oncology Data, Klaus Eckelt, Sandra Wartner, Holger Stitz, David Fuchs, Thomas Gitter, Dominic Girardi, Sebastian Graf, Steffen Krause, Clemens A. Schmitt, Marc Streit, OeGHO & AHOP Spring Conference 2019, Linz, Austria, 2019.

The whole poster as an image.

Reasons For Failure To Give Adjuvant Chemotherapy In Early Breast Cancer - Interactive Visual Analysis Of Clinical Data With The TourGuide Software, David Fuchs, Sebastian Graf, Thomas Gitter, Steffen Krause, Klaus Eckelt, Sandra Wartner, Holger Stitz, Dominic Girardi, Marc Streit, Clemens A. Schmitt, OeGHO & AHOP Spring Conference 2019, Linz, Austria, 2019.

The whole poster as an image.

Theses

Screenshot of StratomeX application with a ranked list of attributes at the bottom. The attributes are ranked based on the similarity to a selected subset of the data.

Diploma/Master's Thesis

Data-Driven User Guidance in Multi-Attribute Data Exploration, Klaus Eckelt, 2018.

Supervisors: Marc Streit, Eduard Gröller

Photo of a 3D printed aorta with an aortic dissection.

Bachelor's Thesis

Vascular Printing - 3D Printing of Aortic Dissections, Klaus Eckelt, 2017.

Supervisors: Alexey Karimov, Gabriel Mistelbauer, Eduard Gröller

Teaching

In my courses, I teach students how to handle, visualize, and interpret data with Python, JavaScript, and business intelligence software such as Tableau and Microsoft PowerBI.

At Johannes Kepler University Linz, I taught multiple courses in the Artificial Intelligence and Computer Science bachelor's and master's programs: Visual Analytics (2018-2023), Computer Graphics (2018-2022), Information Visualization (2019-2022), and Explainable AI (2020-2023).

At the Imperial College Business School, I was instructor for the Visualisation module of the Business Analytics master's program (2019-2021).